Publishers evaluating newsletter advertising consistently ask the same question: what will this actually earn me? The answer depends on five variables that most revenue calculators omit. This guide walks through every input — subscriber count, open rate, fill rate, CPM, and placement count — with real publisher data at each stage size, so you can model your specific situation accurately rather than working from generic industry averages that may not apply to your niche.
What this guide covers:
- The complete revenue formula
- Open rate: the factor most publishers overestimate
- Fill rate: why this is the biggest variable
- CPM benchmarks by niche
- Multiple placements: the revenue multiplier
- Revenue by list size: what publishers actually earn
- Direct vs programmatic: the CPM premium
- The levers for increasing revenue
- Frequently asked questions
The Complete Revenue Formula
Newsletter ad revenue per send has four primary inputs:
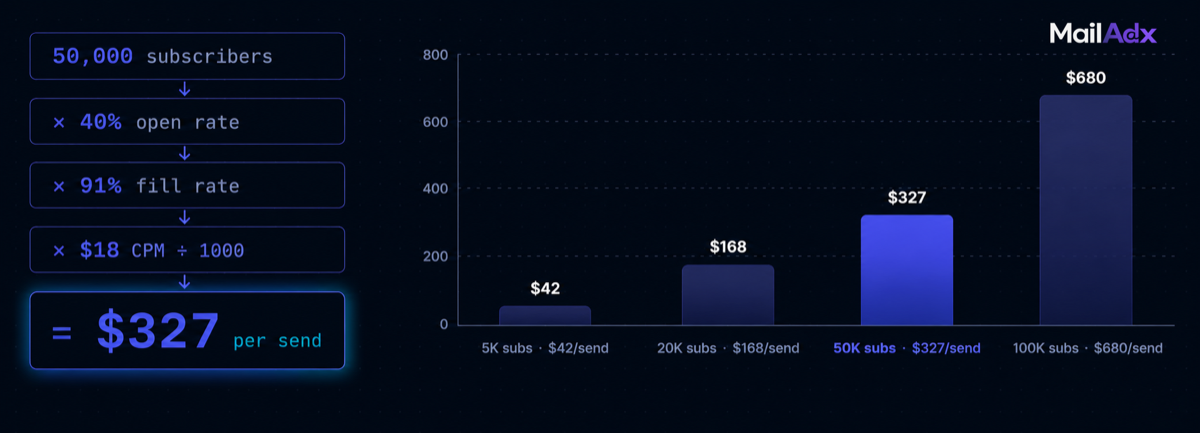
Revenue per send = (Subscribers × Open Rate × Fill Rate × CPM) ÷ 1,000
For multiple placements, multiply the result by placement count (adjusted for each placement's CPM).
An example: 50,000 subscribers × 40% open rate × 91% fill rate × $18 CPM ÷ 1,000 = $327.60 per send. At two sends per week, that is approximately $2,860 per month from a single placement.
This formula contains more nuance than it appears. Open rate, fill rate, and CPM are all variable — they differ by niche, time of year, platform architecture, and configuration choices. Publishers who understand how each input works can optimise each one independently. Publishers who treat them as fixed assumptions will consistently earn below their potential.
For a broader picture of newsletter monetisation beyond advertising, see the complete newsletter monetisation guide for 2026.
Open Rate: The Factor Most Publishers Overestimate
Open rate is the percentage of subscribers who open a given newsletter send. In the context of ad revenue, it defines your impressionable audience — the subscribers whose email clients will request the ad server image and generate a billable impression.
There is a significant complication: Apple Mail Privacy Protection pre-fetches images in emails before subscribers actually open them. This inflates reported open rates by 10–25 percentage points for most newsletters. A newsletter showing 48% open rate in its ESP analytics likely has genuine engagement closer to 35–40%.
MailAdx's open-time ad serving with MPP detectioncounts impressions only on verified human opens — not on machine prefetches. This means your revenue calculation should use verified open rates rather than ESP-reported open rates. Your MailAdx dashboard shows verified impressions, which is the correct denominator.
Average verified open rates by niche, based on MailAdx publisher data:
| Newsletter Category | ESP-Reported Open Rate | Verified Open Rate |
|---|---|---|
| B2B SaaS / Tech | 44–52% | 32–40% |
| Finance / Investing | 40–48% | 30–38% |
| Marketing / Growth | 42–50% | 32–40% |
| Creator / Media | 36–44% | 28–36% |
| General Interest | 28–36% | 22–30% |
When modelling revenue, use the verified open rate column. Using ESP-reported open rates will produce revenue projections that consistently overshoot actual earnings.
Fill Rate: Why This Is the Biggest Variable
Fill rate — the percentage of available impressions that serve a paid ad — is the variable with the widest range across publishers and the most direct connection to platform architecture. Publishers on send-time platforms report fill rates of 55–75%. Publishers using MailAdx's open-time architecture with a properly configured demand waterfall consistently reach 88–96%.
The fill rate impact on revenue is dramatic. Take a 50,000-subscriber newsletter with a 38% verified open rate (19,000 impressions). At $18 CPM:
| Fill Rate | Paid Impressions | Revenue Per Send | Monthly (2×/week) |
|---|---|---|---|
| 60% | 11,400 | $205.20 | $1,795 |
| 75% | 14,250 | $256.50 | $2,244 |
| 88% | 16,720 | $300.96 | $2,633 |
| 94% | 17,860 | $321.48 | $2,813 |
The difference between 60% and 94% fill rate is $1,018 per month on the same newsletter. Fill rate optimisation is the highest-return investment a publisher can make because it requires no audience growth — only better platform architecture and configuration.
See the complete newsletter fill rate optimisation guideand the ad waterfall setup guidefor the specific configuration steps.
CPM Benchmarks by Niche
CPM is what advertisers pay per thousand verified impressions. It varies more than any other input in the revenue formula — by niche, by audience demographics, by whether the placement is direct-sold or programmatic, and by the current state of advertiser demand in that category.
Programmatic CPM benchmarks from MailAdx publisher data:
| Niche | Programmatic CPM | Direct Sponsorship CPM |
|---|---|---|
| B2B SaaS / Enterprise Tech | $16–26 | $60–120 |
| Finance / Fintech | $18–30 | $65–140 |
| Marketing / Growth | $14–22 | $50–100 |
| Developer Tools | $16–24 | $55–110 |
| E-commerce / DTC | $10–16 | $35–70 |
| Creator Economy | $9–14 | $30–65 |
| General Interest | $6–12 | $22–45 |
The direct vs programmatic gap is the most important number in this table. A B2B SaaS newsletter achieving $22 CPM programmatically could be achieving $80–100 CPM with direct sponsorships in the same placements. The revenue difference is 4–5×, which explains why building a direct sponsorship programalongside programmatic is the highest-impact monetisation strategy for publishers in premium niches.
For a comprehensive view of CPM data by audience size and category, see newsletter CPM benchmarks for 2026.
Multiple Placements: The Revenue Multiplier
The formula above assumes one placement per send. Publishers with sufficient newsletter length can run two or three placements, multiplying revenue without increasing subscriber count.
A newsletter with header and mid-content placements earns approximately 1.7–1.9× what a single-placement newsletter earns (not exactly 2× because mid-content CPMs are lower than header). Adding a footer brings the multiplier to approximately 2.1–2.3×.
Example: 50,000-subscriber B2B newsletter, 38% verified open rate, 91% fill, two placements:
- Header at $22 CPM: 50,000 × 0.38 × 0.91 × $22 ÷ 1,000 = $379.06
- Mid-content at $18 CPM: 50,000 × 0.38 × 0.89 × $18 ÷ 1,000 = $302.76
- Total per send: $681.82
- Monthly at 2×/week: $5,964
This assumes slightly lower fill on mid-content (89% vs 91% for header) because mid-content floors are typically lower and attract more demand, but with some variability.
For guidance on configuring multiple placements and setting placement-specific floors and category controls, see the publisher ad unit best practices guide and floor CPM configuration.
Revenue by List Size: What Publishers Actually Earn
Using the formula with realistic verified open rates, 91% fill, and mid-range programmatic CPMs, here is what MailAdx publishers at different list sizes earn from a single header placement, at two sends per week:
| Subscriber Count | Niche | Est. Monthly Revenue |
|---|---|---|
| 5,000 | B2B SaaS | $180–$260 |
| 5,000 | General interest | $60–$100 |
| 20,000 | B2B SaaS | $720–$1,040 |
| 20,000 | General interest | $240–$400 |
| 50,000 | B2B SaaS | $1,800–$2,600 |
| 50,000 | General interest | $600–$1,000 |
| 100,000 | B2B SaaS | $3,600–$5,200 |
| 100,000 | General interest | $1,200–$2,000 |
These figures assume programmatic-only campaigns. Publishers with active direct sponsorship programs in premium niches can earn 3–5× these amounts on the same inventory. A B2B SaaS newsletter with 50,000 subscribers running direct deals at $80–100 CPM earns $6,000–$7,600 per month from header alone — without touching programmatic.
Direct vs Programmatic: The CPM Premium
The data above has one consistent pattern: direct sponsorships pay dramatically more than programmatic for the same inventory. This is not accidental — it reflects two genuine differences in what advertisers are buying.
Programmatic demand is non-exclusive. The advertiser's ad appears in your newsletter when they win an auction — but they're bidding against other advertisers for inventory across many publishers. The CPM reflects competitive market pricing for a category of audience, not the specific premium of your particular newsletter.
Direct deals are exclusive by nature. A sponsor is paying for guaranteed placement in a specific newsletter with a specific audience on a specific date. They are not in competition with anyone else. The scarcity premium this commands — combined with the certainty of delivery — supports CPMs 3–5× above programmatic rates in most niches.
The optimal strategy is to run both: direct deals at the top of the waterfall capturing the premium when sponsors are live, programmatic filling everything else at competitive market rates. Neither replaces the other; together they maximise both peak and floor revenue.
See building a direct-sold newsletter sponsorship program and the waterfall setup guidefor how to run both in a single configuration.
The Levers for Increasing Revenue
Publishers who want to increase ad revenue have five distinct levers — ranked here by the typical effort-to-return ratio:
1. Raise fill rate above 90% — Switching to open-time architecture and configuring a four-tier demand waterfall. High impact, one-time setup effort. The MailAdx publisher portal handles all configuration.
2. Add a direct sponsorship program — The highest CPM leverage available. Requires outbound sales effort but no technical changes. Even one direct sponsor per month dramatically changes the revenue profile of a premium niche newsletter.
3. Add a second placement — A mid-content placement in a newsletter with sufficient editorial content generates 60–80% of header revenue with minimal operational overhead.
4. Calibrate floor prices — Raising floors incrementally in $2–3 steps as fill-rate data confirms demand depth. The floor CPM guide covers this process.
5. Grow the list — The slowest lever and the one that receives the most attention. Audience growth is valuable, but it is less immediately impactful than optimising the economics of the existing audience. Publishers who double their list size with unoptimised fill rates and send-time platforms earn less than publishers with half the list size on a well-configured open-time stack.
Frequently Asked Questions
Is there a minimum subscriber count to earn meaningfully from newsletter ads?
There is no platform minimum on MailAdx, but practical economics suggest programmatic-only revenue becomes meaningful above approximately 5,000 subscribers in a premium niche (B2B, finance, developer tools) or 15,000–20,000 in general interest categories. Below these thresholds, direct sponsorships are often the higher-return approach — the audience may be small but highly specific, which commands direct CPMs that programmatic demand doesn't match.
How does send frequency affect monthly revenue?
Revenue scales proportionally with send frequency — two sends per week at $300 per send generates twice what one send per week at $300 per send generates. The important caveat: higher send frequency may reduce per-send open rates over time if content quality declines. Revenue per subscriber-month stays similar at consistent quality; declining quality shrinks both open rates and fill rates.
Do I earn from subscribers who open on multiple devices?
With open-time serving, each open generates a potential impression. If a subscriber opens your newsletter on their phone in the morning and on their desktop in the afternoon, two impression events fire — subject to frequency caps. Frequency caps prevent excessive impression delivery to any single subscriber hash, ensuring advertiser budget is spent on genuine reader attention rather than repeated impressions to the same person. See how email hash-based frequency capping works.
What revenue should I project for my first month?
Expect the first two to three weeks to run below long-term averages as your account builds audience history and demand optimises. Programmatic CPMs typically improve 15–25% from week one to week six as the platform learns your audience's attributes. Plan for 70–80% of the calculated revenue in the first month and full-rate by month two.
Calculate your actual revenue potential
Set up your first placement in MailAdx and see real fill rate and CPM data within your first send.
No minimum subscribers · No revenue share · Works with your existing ESP


